
Mark J C Nuijten1,2* and Jan Vis3
1A2M (Ars Accessus Medica), 1546 LG Amsterdam, The Netherlands
2H4V, 1546 LG Amsterdam, The Netherlands
3Talanton, Amsterdam, The Netherlands
4RSM, Erasmus University, Rotterdam, The Netherlands
Rational: Many pharmaceutical companies, especially biotechnology companies, are now commercializing innovative so-called expensive medicinal products, e.g. biologicals, and especially orphan drugs, with an incremental cost-effectiveness ratio (ICER), which will probably exceed threshold values that are commonly regarded as acceptable for reimbursement.
Objective: The goal of this paper is to propose an additional methodology to evaluate and valuate innovative drugs from a broader perspective by applying concepts from business valuation, when the ICER exceeds the threshold.
Methods: Medical innovation relies on the market mechanisms in the finance market of biotechnology including the incentives of the various stakeholders, especially the capital providers, who demand a required return on investment. The justification of the orphan drug price can be based on the Discounted Cash Flow method, which is based on the expected free cash flows and the required cost of capital, and can be used to validate the price of the new drug from a narrow investor’s perspective.
Conclusion: We propose an alternative policy approach for the evaluation of ultra-innovative drugs from a broader perspective by bridging concepts from health economics and the economics of business (economic) valuation. This approach may justify a drug price, especially when ICER exceeds the threshold.
The decision of health authorities about coverage of a medicinal product in the health insurance package is based on the value for money of a new medicinal product. Health technology assessors will make a trade-off between the incremental, clinical benefit and the premium price of the new medicinal product versus standard therapy and give a recommendation to the health authorities. The current most important criteria for coverage decisions are effectiveness, cost-effectiveness and budgetary impact. A cost-effectiveness analysis (CEA) provides an incremental cost-effectiveness ratio (ICER) defined as the cost per quality adjusted life year (QALY) gained. In the United Kingdom the National Institute for Health and Care Excellence (NICE) has adopted an incremental cost effectiveness threshold range of £20,000 to £30,000 per QALY gained, which means that the English society is willing to pay up to £30,000 per QALY gained for a new, innovative, medicinal product1. In the case of end-of-life treatment an ICER up to £55,000 may be accepted. Other proposals include a differential threshold value between diverse disease and treatment characteristics: for example in The Netherlands, a range between €10,000 and €80,000/QALY has been suggested1. In contrast, cost-effectiveness has limited relevance in Germany, where the main decision criteria are the incremental clinical benefit compared with standard care and the budget impact. A budgetary impact analysis (BIA) shows the impact of a new medicinal product on the annual national medicinal product budget (drug budget) and total health expenditures.
Many pharmaceutical companies, especially biotechnology companies, are now commercializing innovative so-called expensive medicinal products (drugs), e.g. biologicals, and especially orphan drugs, with an ICER, which will probably exceed the upper threshold (e.g. €80,000/QALY in The Netherlands). In addition the annual costs per patient are probably considered substantial from the perspective of the payer. As a consequence, the drug is sometimes rejected for reimbursement by the technology assessors. The goal of this paper is to propose an additional methodology to evaluate and valuate innovative drugs from a broader perspective by applying concepts from business valuation, when the ICER exceeds the threshold. We focus on new ultra-innovative orphan and non-orphan biologicals, which are the first in class drugs, and therefore do not consider follow-on “me-too” drugs. We prefer to use the term ultra-innovative instead of expensive, which implicitly includes a value judgment of “too expensive”. In this paper we focus on the orphan drugs for purpose of illustration, but the concepts can also be applied to non-orphan biologicals.
We do not challenge the use of cost-effectiveness data for the reimbursement of drugs, as most classic health economists may not be willing to accept another cost-effectiveness approach for expensive drugs. For example, for orphan drugs, they may not want to consider issues like sample size, heterogeneity, the appropriateness of quality of life (EQ-5D and SF-6D) for orphan diseases, low limited clinical evidence at time of launch, or the acceptance of a higher threshold. We also do not challenge general health economic concepts, although there is not yet full consensus on all methodological issues (e.g. discounting of outcomes, inclusion of social values, the justification of the cost per QALY threshold). Hence we accept the incremental cost-effectiveness outcomes based on health economic concepts, but we explore the additional use of the outcomes of an analysis based on business valuation concepts in the reimbursement decision-making process, when the ICER exceeds the threshold. The outcomes of this business valuation approach may provide an economic justification of a drug price, when the ICER exceeds the threshold.
We develop the concept from the narrow perspective of the investor in the pharmaceutical market to see if drug prices for ultra-innovative (“expensive ”) drugs are justified based on business valuation theory. This analysis does not include all other monetary and non-monetary values for the society (patients, physicians, payers, providers and employers). The concept mainly is applicable for Europe, because the US has a much different system that does not utilize cost-effectiveness data and has a less centralized system for reimbursement decisions for medicinal products.
In a free market the ideal cost estimate for each resource use would be its opportunity cost, defined as the missed advantage of the alternative that is not chosen. Opportunity costs are reflected as the price in a perfectly competitive marketplace, although perfect markets do not exist in reality. However the health care marketplace has many distinguishing features (e.g. information asymmetries, market distortions, government interventions and cross-subsidies) that make it a less than perfect market. Therefore, routinely used prices of health care goods and services (e.g., charges and reimbursements) are not true opportunity costs. At best, health care market prices can be viewed as "proxy" costs, which can be either higher or lower than opportunity costs. However patients in the health care market do not pay directly for treatment (moral hazard), and consequently the price of a health care service will not bring demand and supply into balance (Figure 1): The demand by the patient will not be limited by the price, while an increasing supply of health care services will reduce the price and providers may even have financial incentives to increase the volume of health care services. The third party, the health insurer, who is responsible for direct payment, may have some control over price, but much less control on volume. Although a health insurance company can pass on the cost of this excess expenditure through increased contributions, these extra costs are distributed across those insurees.
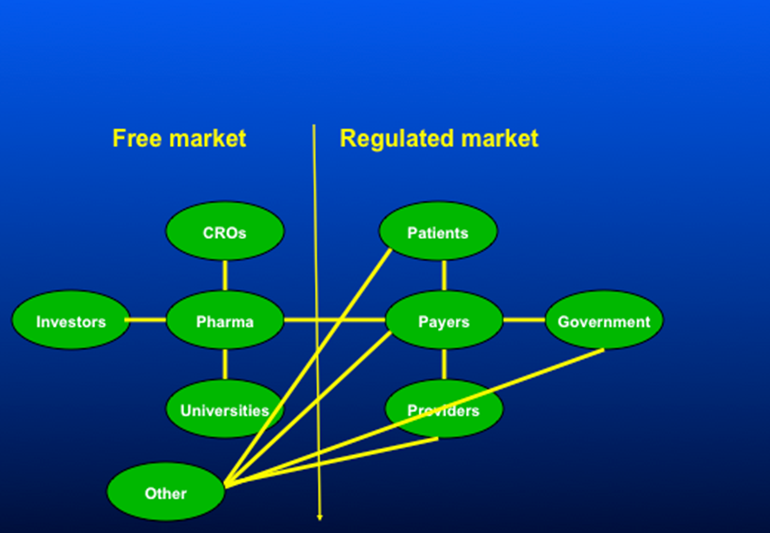
Figure 1:split markets in finance and health care
In a pure market economy the price of the new innovative drug would be determined by demand and supply mechanisms, and all previous considerations about the use of cost-effectiveness data or the recent proposals for multiple criteria decision-making would be unnecessary. On the other hand, the health authorities leave the responsibility for medical innovation to the market, although medical innovation has a much broader value than the economic value for the pharmaceutical company and the investors (capital providers). Therefore medical innovation relies on the market mechanisms in the finance market of biotechnology including the incentives of the various stakeholders, especially the investors, who demand a required return on investment. The investor’s decision-making process includes not only economic attributes but also societal values, as an investor is a human being with multiple roles in society. In the current health care environment where the policy is that innovation relies mainly on business entrepreneurship, health authorities have to accept the market mechanisms in all resource markets including the finance market, especially an adequate return on investment for investors in order to benefit from the societal value of medical innovation, which may increase the quality of life and well-being of their citizens. A pharmaceutical or biotechnology firm, on the other hand, sees pharmaceutical innovation as an opportunity to be rewarded for successful research & development (R&D) work and for adding ‘value’, which can be reinvested in future innovation. Without the prospect of rewards for innovation, R&D and the pace of innovation will decrease. Health authorities often challenge the high price of orphan drugs, wherever a pharmaceutical or biotechnology company would argue that innovation requires significant investments. A firm is a collection of productive resources (human, and non-human) under administrative coordination and authoritive communication that produces goods and services for sale in the market for profit2. Administrative coordination and authoritative communication define the boundaries of the firm. The investors provide capital to the firms, which transform this capital to capital goods. This process requires a return on invested on capital because the providers of money-capital require a reward.
An assessment based on business valuation theory from the narrow perspective of the investor in the pharmaceutical market may be used to see if drug prices for ultra-innovative (“expensive”) drugs are justified. As the health authorities leave medical innovation to the market, this perspective is also included in the broader societal perspective, which includes additional elements and values. If we assume that the new drug is the only product of a company, we can calculate the economic value of this company. This valuation is based on the Discounted Cash Flow method, which is based on the free cash flows and the required cost of capital. Free cash flow is often defined as the cash flow from operations minus the cash necessary for capital expenditures. Cash flows from operations represent the sales from the pharmaceuticals, and cash necessary for capital expenditures represents the costs for R&D, production costs and marketing.
The cost of capital refers to the opportunity cost of making a specific investment. It is the rate of return that could have been earned by putting the same money into a different investment with equal risk. Thus, the cost of capital is the rate of return required to persuade the investor to make a given investment3. The cost of capital is determined in the market by the demand and supply of capital. Investors provide their capital to a company temporarily, and request a return on investment based on their perceived risk, which is the quantifiable uncertainty. When given the choice between two investments of equal risk, investors will generally choose the one providing the higher return. Cost of capital depends on the mode of financing used – it refers to the cost of equity if the business is financed solely through equity with an adjustment to the cost of debt if it is financed partially through debt. Many companies use a combination of debt and equity to finance their businesses: the overall cost of capital for these companies is derived from a weighted average of all capital sources, known as the weighted average cost of capital (WACC)3. Since the cost of capital represents a hurdle that a company must overcome before it can generate value, it is extensively used in the capital budgeting process to determine whether the company should proceed with a project or investors should fund this company.
The justification of the orphan drug price can be based on the Discounted Cash Flow method. As the future financial performance of a pharmaceutical company is directly related to the free cash flow (FCF) of a new drug, an appropriate assessment of the potential sales forecast of a portfolio of forthcoming new drugs is an important element of the financial value of a pharmaceutical company3. Nowadays, such an assessment should definitely include the estimated effects of the new emerging requirements for reimbursement authorities and payers and the effects of pharma policy changes4. After the assessment of the free cash flow, the Discounted Cash Flow method can be applied to determine the threshold for the cost of capital, which can be compared with the required cost of capital in the pharmaceutical industry in order to justify the appropriateness of the drug price. Alternatively we can compare the break-even price for the innovative drug, where the net present value is zero, with the actual drug price in order to assess if the applied drug price is justified from business valuation theory. When the break-even price is higher, the actual price may not attract investors, but if the break-even price is lower, the actual drug price may not be justified using valuation theory.
If we assume that the new drug is the only product of a company, we can calculate the economic value of this innovation, which is, in this case, similar to the economic value of the company. In this case, we can apply this method to validate the price of the new drug. On the other hand, if the company has more products in development or drugs already on the market, we may consider two approaches:
Project approach: Estimate the free cash flows only for the new drug by allocation of the incremental cash in and cash out to the new drug and consider it as a project, which requires a drug price to result in a required cost of capital (threshold price).
Company approach: Use the total free cash flows for the company and include future revenues and costs to the new drug in the free cash flows in order to calculate the threshold price.
We consider the “project approach” the most appropriate, as the “company approach” may not be sensitive to link the price of the new drug with the cost of capital because of the new drug is only part of a portfolio that includes other drugs in development and/or on the market. However the project approach requires an appropriate allocation of the incremental costs, which are not directly related to the new innovations (e.g. overhead), and to the cash flow of the new innovation.
The discounted cash flow is derived from the present value equation to calculate the present value of future, expected cash flows and compounding returns.
DCF= CF1/((1+r)1+CF2/((1+r)2+---+CFn/((1+r)n (Eq 1.)
Where
DCF = discounted cash flow = present value
CF = (free) cash flow
n = the time in years before the future cash flow occurs
r = cost of capital
The time horizon for the cash flows starts at the time of patent registration and continues until the end of the patent period, which is 20 years. We assume that the product is registered at year 8 and is reimbursed the same year leaving 12 years for actual sales5.
The development and other related costs before obtaining the patent in year 1 are not included in this analysis and are considered sunk costs5.
In the next sections we address free cash flows and the cost of capital in more detail. We conclude this section by addressing the timing of analysis and inclusion of failures.
Free cash flow is defined as:
Profit before interest and tax (EBIT)
Minus: Corporation Tax
Equal: Net Operational Result
Plus (+) Depreciations/Amortizations
Plus (+) Mutations in Net Working Capital plus Mutations in Provisions
Minus (-) Investments
Plus (+) Divestments
In the remainder of this section we focus on revenues and expenditures.
The future revenues are based on a sales forecast of a new drug, is QxP, whereby Q is quantity sold and P is price per unit3. The quantity sold (Q) is a function of drug utilization per patient and the number of potential patients.
Drug utilization per patient depends on the duration of treatment and dosing, which depends on the disease and treatment guidelines. During the treatment of some patients, the drug may be discontinued because of adverse events or lack of response. Other patients may continue the medication for a longer period in chronic diseases, e.g. multiple sclerosis. The next step then comes by calculating the total sales forecast by multiplying three components: average drug utilization per patient, unit drug price and number of patients based on epidemiologic and other specific sales forecast data.
The potential number of candidates of the target population for a new pharmaceutical depends on epidemiology (prevalence and incidence of the disorder), possible prescription restrictions, contraindications, annual growth of the target population, off-label use, and diffusion curves. Prevalence may be the main driver in a sales forecast for indications in chronic diseases, while incidence may be the main driver for episodic diseases with full recovery or death (e.g. infectious diseases) or disease types like cancer, where the initiation of treatment starts at diagnosis and selection of treatment is based on staging (e.g. adjuvant or advanced treatment).
Diffusion curves or uptake curves reflect the annual proportion of eligible patients that is actually going to use the new pharmaceutical. The uptake may be a function of various parameters, including incremental clinical benefit (which is positively associated with uptake), and marketing power and an established network with the medical community by the pharmaceutical company. We distinguish between actual data and forecasts, e.g. response data from the clinical trials are actual data, and uptakes curves are forecasts.
The sales forecast is a function of the following parameters6: Drug costs = F(DTC, P_response, P_fail, P_AE_stop ): actual dataDCT: daily treatment price of the new drug P_response: probability of response to the new drugP_fail: probability of failure of the new drug after initial response P_AE_stop: probability of discontinuation of new drug due to adverse events (AE)Number of patients = F(Pop, P_inc, P_prev, P_contra, P_growth, P_uptake_n1,n2..nk): actual data and forecasts Pop: population sizeP_inc: incidence/P_prev: prevalence P_contra: probability of contraindicationsP_growth: annual growth of the population P_uptake_n1,n2..nk : annual uptake in year 1,2,… k. |
The break-even price of the new drug can be based on the actual expenditures of the biotech company. However, if the company is managed inefficiently thereby resulting in higher expenditures, the company should not be rewarded for a higher drug price. The allocation of general costs to the project can also be subjective and lead to a higher drug price. Therefore the use of actual accounting data should be considered cautiously and calculations based on those data may not be straightforward be used without any dispute. In addition historical bookkeeping costs may not reflect the actual cash flows and future opportunity costs. In addition prices and costs do not reflect economic value3.
Therefore we consider the use of standard costs for the development (phase I, II and III) and marketing of a new innovative product, which should reflect the actual costs for development and can be applied for every business valuation. In our example, we used published costs from the literature, but further research evaluation is required in order to establish standard costs, which should be applicable, when the development, production and marketing are managed efficiently. The costs of the development (phase I, II and III) are absolute monetary values, whereas the sum of production and marketing costs are based on 40% of revenues5. Another consideration is that R&D costs may vary for low prevalence orphan drugs7. Some factors would increase these costs (e.g., imagine a disease where there are only 50 patients in a country like the UK: just identifying patients for trials would be costly), while others could decrease them (orphan drugs acts in the US and Europe allow for smaller shorter trials for rare diseases).
The cost of capital, as expected by market participants, is based on the average cost of capital in the pharmaceutical market. Harrington reports that for 2006-2008, the costs of equity capital estimates are approximately 9% for pharmaceuticals, 11% for device firms, and 12% for biotechs8. For the purpose of illustration we used in the example below applying our business valuation concept the 12%, but the assessment of the appropriate cost of capital requires a more in-depth analysis in our further research.
The allocation of R&D failures to successful drugs obtaining EMEA or FDA approval is an important element in the valuation. The health authorities may only consider R&D costs, which are directly related to the new drug, whereas the R&D costs of the unsuccessful programs should be taken into account according to the principles of business valuation.
The probability of failure during the development (phase I, II and III) phases is also derived from the literature instead of company data in order to exclude ineffective management of clinical trials (design, process). In addition, the statistical power may not be sufficient using limited data from one company. Finally the perspective of the analysis is more that of the investor than that of the pharmaceutical company. The diversifiable risks may not need to be rewarded with a premium, because an investor can eliminate them by holding a large diversified portfolio. The main risk factor of a biotech company is the clinical success of its projects, which is typically such a diversifiable risk. This may also apply to reimbursement risk of failure. The success rates should not have an influence on the cost of capital. Therefore in the current model we include failure probabilities only in the cash flows.
The current analysis starts at T=1, which is the year of patient registration. We assume that EMEA/FDA approval occurs at year 8 and that reimbursement dossiers are subsequently submitted in the countries. We assume that there is a reimbursement decision within 1 year after registration leaving 12 years for sales before the patent expires. In this paper, we propose a methodology for justification of drug prices, when the ICER exceeds the threshold and therefore cost-effectiveness becomes a hurdle for reimbursement. In this analysis we assume that the health authorities are convinced of clinical benefit based on registration.
Therefore, the probability of reimbursement following registration is 100% in the base case analysis. However a scenario analysis may be based on the probability of rejection of reimbursement because the health technology assessors are not convinced of the clinical benefit. The price justification may be required at T=8 (reimbursement). Therefore there is no difference in analysis from T=1 or T=8 because of appropriate handling of probability of treatment failures. In the T=8 analyses it is not appropriate to ignore the probabilities of failures during an R&D phase or use different cost of capital because of less uncertainty after the registration.
T=1: DCF= CF1/((1+r)1+CF2/((1+r)2+---+CFn/((1+r)20
Where CF1- CF8 is cost of R&D and CF9- CF20 is sales – cost of marketing
T=8: DCF= CF9/((1+r)1+CF2/((1+r)2+---+CFn/((1+r)n20
MINUS costs of R&D*discount * correction for failure
We apply the proposed approach to Pompe disease, which has an incidence of approximately 1 in 40,000 live births9,10. However, as with any rare disease, it is difficult to know exactly how many people are actually affected. Extrapolating from the assumed incidence figures, it is estimated that the average current worldwide prevalence may be 7,500 people11.
Product X illustrates a business case for the development of innovative medicine for Pompe disease. We assume that the new drug must at least achieve benchmark clinical outcomes versus standard treatment. The drug price for Product X (US$ 300,000) is much higher than for other broader indications, because the pharmaceutical company will invest the same amount of money in developing an orphan drug, which will only treat a limited number of people around the world. They will still need to recoup that investment somehow, but with fewer potential patients the cost per patient will rise12. However this higher drug price for Product X cannot lead to an acceptable ICER below the willingness-to-pay threshold and consequently Product X will not be reimbursed using the current cost-effectiveness threshold. As a consequence we apply the proposed valuation methodology in this paper.
Table 1. A economic model defining feasible development options5.
| Model parameter | |
|---|---|
| Cost of development (US$ million) | US$704.56 million |
| Phase I | US$84.07 million |
| Phase II | US$142.65 million |
| Phase III | US$189.73 million |
| Phase IV | US$68.33 million |
| Years of development & approval | 8 year |
| Period reimbursement | 1 year |
| Net patent life (years) | 12 |
# of eligible patient /year (US+EU) |
25,000 |
| Drug price per patient | $ 300,000 |
| Years to reach peak | 6 |
| Cost of revenue (%) | 40 |
| Cost of capital | 12% |
| Probability | |
| - Phase I to II | 0.70 |
| - Phase II to III | 0.39 |
| - Phase III to FDA approval* | 0.69 |
* Assumption: same probability for EMA
The analysis incorporates average phase transition probabilities received from various sources (i.e. phase I-II 0.70; phase II-III 0.39; phase III-approval 0.69)13. It is assumed that successfully development (including approval time) of a drug requires 8 years and involves costs of US$704 million13.
The maximum number of patients is 7,500, but usually not all patients will likely be eligible (e.g. contraindications). If we assume that 10% of patients is not a candidate for Product X, the eligible population size is 6,750. The commercial time to reach peak sales (80% of the market) is assumed to be the industry average of 6 years14. An analysis of financial reports of small, mid-size and large biopharmaceutical companies indicates an average cost of goods sold plus selling, and administrative cost of 40% of sales5. The model includes a tax rate of 25%, which is included already in the applied figures.
Table 2 shows the results of DCF with a net present value (NPV) of US$ $21,620,845 for drug price of US$300,000 for Product X.
| Stage | Year | Continue | Costs - R&D | Sales | Costs -marketing | NPV |
|---|---|---|---|---|---|---|
| preclinical | 0 | 1 | $(217,910,000) | $0 | $0 | -$217,910,000 |
| Phase 1 | 1 | 1 | $(42,035,000) | $0 | $0 | -$37,531,250 |
| 2 | 1 | $(42,035,000) | $0 | $0 | -$33,510,045 | |
| phase 2 | 3 | 1 | $(71,325,000) | $0 | $0 | -$50,767,726 |
| 4 | 0.39 | $(71,325,000) | $0 | $0 | -$45,328,327 | |
| phase 3 | 5 | 0.39 | $(24,664,900) | $0 | $0 | -$13,995,527 |
| 6 | 0.39 | $(24,664,900) | $0 | $0 | -$12,496,006 | |
| 7 | 0.2691 | $(24,664,900) | $0 | $0 | -$11,157,148 | |
| approval | 8 | 0.2691 | $(503,217) | $0 | $0 | $0 |
| sales | 9 | 0.2691 | $(3,677,521) | $72,657,000 | $29,062,800 | $14,394,355 |
| 10 | 0.2691 | $(3,677,521) | $145,314,000 | $58,125,600 | $26,888,268 | |
| 11 | 0.2691 | $(3,677,521) | $217,971,000 | $87,188,400 | $36,539,673 | |
| 12 | 0.2691 | $(3,677,521) | $290,628,000 | $116,251,200 | $43,814,253 | |
| 13 | 0.2691 | $(3,677,521) | $363,285,000 | $145,314,000 | $49,110,535 | |
| 14 | 0.2691 | $0 | $435,942,000 | $174,376,800 | $53,521,422 | |
| 15 | 0.2691 | $0 | $435,942,000 | $174,376,800 | $47,786,984 | |
| 16 | 0.2691 | $0 | $435,942,000 | $174,376,800 | $42,666,950 | |
| 17 | 0.2691 | $0 | $435,942,000 | $174,376,800 | $38,095,491 | |
| 18 | 0.2691 | $0 | $435,942,000 | $174,376,800 | $34,013,831 | |
| 19 | 0.2691 | $0 | $435,942,000 | $174,376,800 | $30,369,492 | |
| 20 | 0.2691 | $0 | $435,942,000 | $174,376,800 | $27,115,618 | |
| $21,620,845 |
Table 2. Results of the DCF valuation
Break-even analysis for NPV =0:
Break-even cost of capital: 12.4%
Break-even price: US$285,576
This analysis shows that price of US$300,000 is only slightly higher than a break-even price of US$285,576 for a cost of capital of 12% and the break-even cost of capital is only 12.4%. Therefore the price of US$300,000 can be justified based on business valuation concept, especially taking into consideration the low cost of capital of 12% and not taking into account discontinuation after treatment failure.
The appendix provides details about methodological considerations, which are summarized in this section.
In the analysis, every parameter that influences the economic value, can be incorporated into either the free cash flows or the cost of capital. The operational expectations should ideally be included in the numerator (free cash flows) of the present value equation (Eq1) and the financial expectations in the denominator (cost of capital). This mutual exclusive approach would avoid the risk of double counting3.
The cost of capital for biotechnology is an average value with an uncertainty distribution, which means that cost of capital may vary based on company specific features. Biotechnology companies are smaller companies and therefore a small firm premium may be added. The discount rate usually decreases as the maturity of the company increases15. The cost of capital should not be based on the expectations at the time of the reimbursement application, but rather on the expectations at the time of investment.
The introduction of innovation is a unique one-time event, whereas retrospective statistical data on treatment patterns relate to the health care setting in the past. The actual use of an innovation refers to the future3. Therefore any existing statistical data should be considered with caution when making a sales forecast and therefore requires validation, especially regarding the applicability of the existing data for an appropriate forecast.
The efficacy from randomized clinical registration trials may not be representative of the effectiveness of the intervention in the actual target patient population16. The efficacy of a new medicinal product in daily practice may be different than the clinical trial data16, which may have an impact on the sales forecast, since a lower efficacy may lead to a higher discontinuation rate and lower actual sales.
In business economics, uncertainty reflects a property, because humans cannot predict the future (uncertainty is the observation that the future is not known), whereas risk is the probability that an actual event will occur, and in valuation is the probability that the materialization deviates from the expectation and as a consequence can be calculated (risk is assigning quantitative probabilities to alternative future outcomes)3. Therefore risk corresponds with statistical distributions of input variables and uncertainty in business economics corresponds partially with uncertainty due to assumptions for the model, but it also may include unknown future changes. Standard sensitivity analyses can be applied to risk, whereas scenario analyses are more appropriate for uncertainty.
The substitution effect and the gain in QALYs of a new medicine are not included the Discounted Cash Flow method. However investors have multiple functions. They are not only professional investors, but also insured citizens. Economics is not only about money. People act because they want to achieve a more preferable position of situation. Therefore the decision making process does not only include economic attributes but also other values, e.g. social values. As a result, substitution effect and the gain in QALYs may already be partially included in the current financial valuation from am investor’s perspective.
The Discounted Cash Flow method has not been formally used until now by health technology assessors, although this method has been used for many decades in the financial world. The budget impact analyses by health technology assessors essentially include the revenue aspects of Discounted Cash Flow method, but these analyses do not include the costs of R&D and the appropriate cost of capital, and are only performed over a limited time horizon of 3 to 5 years.
The perspective used in cost-effectiveness and these budget impact analyses is that of the health authorities, which does not take into consideration that drug prices for ultra-innovative drugs should also be justified from the perspective of the investor in the pharmaceutical market, if innovation is going to be left to the market.
Healthcare innovation has added substantial value to patients, the medical community and the society at large in terms of improvements in healthcare. Moreover, healthcare innovation is able to generate real financial gains to economy and society that outlasts patent life. However the cost-effectiveness of many ultra-innovative drugs will probably exceed the threshold of the incremental cost-effectiveness ratio, which will lead to negative reimbursement decisions in countries, where cost-effectiveness is the main criterion in the reimbursement process.
In this paper, we propose an alternative policy approach for the evaluation of ultra-innovative drugs from a broader perspective by bridging concepts from health economics and business economic valuation. This approach may justify a drug price, especially when ICER exceeds the threshold. If innovation is funded continuously, future generations will reap even greater rewards, which also include direct investment of the sales of the new drug in development for other indications or indirect investment of the sales in the development of another clinical entity. For health care systems that do not use the ICER, our proposed alternative policy approach may put the usually high budget impact of ultra-innovative drugs in a broader perspective taking into consideration the investor’s perspective, which is critical for innovation.
In the analysis, every parameter, which influences the economic value, can be incorporated in either the free cash flows or the cost of capital. If a parameter has a direct impact on the sales forecast or costs, it will be included in the free cash flow. When a parameter has no impact on the mean cash flow but does lead to a higher uncertainty in the outcome (standard deviation), the mean deterministic outcome of the economic valuation will not change. In this case we can add this uncertainty in the cost of capital, by adding a risk premium, leading to lower economic value and a higher drug price may be justified. The cut-off point for adding a risk premium and the size of risk premium are subjective: this topic may require further research. The probabilities of failure during development and reimbursement are included in the cash flow forecast as mentioned before. Finally, we can include all parameters that have no direct impact on the free cash flows, by adding a risk premium (or risk discount) to the cost of capital.
Possible parameters are a joint venture with academic centers and management team with proven track record in developing new products. Double counting of uncertainty should be avoided by not including it in the cost of capital, when it is already included in the cash flows. The operational expectations should ideally be included in the numerator (free cash flows) of the prevent value equation (Eq1) and the financial expectations in the denominator (cost of capital). This mutual exclusive approach would avoid the risk of double counting3.
The cost of capital for biotechnology is an average value with an uncertainty distribution, which means that the cost of capital may vary based on company specific features. For example, an important determinant of the cost of capital is leadership and track record of previous successful launches3. Therefore sensitivity analyses may be performed by varying the cost of capital from the lower to the upper limit. In addition scenario analyses may be performed using different assumptions, which may lead to different cost of capital thresholds (or break-even prices). On the other hand, this spread in cost of capital is a diversifiable risk in an efficient market, which may not need a premium. However, in reality efficient markets do not exist.
The cost of capital threshold, or expected return of the market, can be based on the average cost of capital in the pharmaceutical market. Biotechnology companies are smaller companies and therefore a small firm premium may be added. Usually the discount rate decreases the more mature a company is15. While a start-up or a company that is still in discovery stage faces a high cost of capital of over 20%, a clinical stage company can already use a lower discount rate. When a company has already a drug on the market the cost of capital usually is already close to the discount rate of a pharmaceutical company, i.e. between 8% and 10%. So the discount rate seems to depend mainly on the stage of a company. There is no doubt that the most important property of the stage of a company is its probability to ultimately take one project to the market and create value added (or economic profit). We therefore can observe a direct relationship between success rate and risk premium. In the marketplace we can observe a consistent decrease in the discount rate with advancement of the stage of the company. This would mean that the cost of capital could also be adjusted annually over the years until registration and subsequently a fixed annual cost of capital can be applied after market launch.
Another consideration is that the cost of capital should ideally be based on the expectations at the time of investment (at T=0). Therefore the application of our approach for justification of a drug price in 2016 should be based on cost of capital in 2008.
The cost of capital in this report was based on the Capital Asset Pricing Model (CAPM), which is based on the neoclassic equilibrium concept, where prices are similar to values and consequently there are no incentives for entrepreneurship. In reality, the actual cost of capital originates from the direct environment of the individual capital provider3. The possibilities or opportunities of this individual capital provider determine the opportunity costs.
If the considerations of the individual capital provider are not known, an alternative approach is to explore if the cost of capital applied by other individuals or companies may provide guidance. The agreements on the capital market may be partially visible, as the outcomes may be in the public domain, but the underlying motives and considerations (contemplations), which resulted in a specific outcome, are not known. When this last approach is chosen, it usually results in the thoughtless application of the so-called Capital Asset pricing Model (CAPM), which is mathematically a sophisticated concept. However, this approach suffers from economic flaws, as it based on very strict and unrealistic assumptions using historical data3.
An alternative approach is to use the subjective opportunity cost approach. The cost of capital reflects 1) a postponement of consumption, 2) the risk of no or lower reward, and 3) changes in the purchasing power of money.
For the capital provider in this example, there are other investment opportunities with a similar risk profile, which may yield an annual 12% cost of capital. Therefore in the current analysis, we used the individual opportunity cost approach.
The introduction of innovation is a unique one-time event, whereas retrospective statistical data on treatment patterns relate to the health care setting in the past. The actual use of an innovation refers to the future3. For example, how will the innovation be adopted by the medical community in a changing health care environment with other new emerging innovations, modifications of clinical guidelines, changing reimbursement and financing systems? Therefore any existing statistical data should be considered with caution for making a sales forecast and requires a validation, especially how the existing data can be applicable for an appropriate forecast.
This concern is also relevant for the forecast of the expenditures for costs of R&D, production and marketing. In health economics it is standard to extrapolate retrospectively collected costs to future years, and even for life-time analyses. However in economic valuation the use of historical bookkeeping data is not recommended, as it does not reflect the economic value. The costs for R&D may also not reflect the actual opportunity cost, because hospitals are involved in clinical trials and the health care marketplace has many distinguishing features (e.g., information asymmetries, market distortions, and cross-subsidies) that make it less perfect than other markets.
Besides the constraints in business valuation for using current data, using existing data in health economics is also considered cautiously because of limitations in external validity. The efficacy seen in randomized clinical registration trials may not be representative of the effectiveness of the intervention in the actual target patient population16. Inclusion criteria for patients and selection of study sites may mean that the sample is not representative of the potential future patient population. As a consequence, the efficacy in real life may be different than the clinical trial data, which may have an impact on the sales forecast, e.g. a lower efficacy may lead to higher discontinuation and lower actual sales.
It is important to note that health economics uses the concept of uncertainty in a different way than business economics. Uncertainty in health economics reflects probabilities of treatment failure and treatment decisions. iii We can distinguish uncertainty due to 1) statistical distributions of input variables, and 2) uncertainty due to assumptions for the model and the applied data sources. In business economics, uncertainty reflects a property, because the human being cannot predict the future (uncertainty is the observation that the future is not known), whereas risk is the probability that an actual event will occur, and in valuation it is the probability that the materialization deviates from the expectation and as a consequence, can be calculated (risk is assigning quantitative probabilities to alternative future outcomes)3. Therefore risk corresponds with statistical distributions of input variables. Uncertainty in business economics corresponds partially with uncertainty due to assumptions for the model, but it also may include unknown future changes17. Standard sensitivity analyses can be applied to risk, whereas scenario analyses are more appropriate for uncertainty. A sensitivity analysis is based on the statistical distribution to judge the effect on study results of by varying the value of the input parameters from the lower to the upper value of the confidence interval18. A scenario analysis is based on the modification of the underlying assumptions of the model in order to capture uncertainty, which is not included in the statistical distribution of the input parameters. Of course no scenarios can be performed for so-called “unknown unknowns”, so the full extent actual uncertainty can never be captured and will remain unknown.
Many parameters in a cash flow forecast model are not based on actual data with an appropriate distribution, but these parameters are based expectations. Examples are annual growth, uptakes curves, substitution effects, changes in prescription restrictions and guidelines, future distribution of the available treatment modalities, and off-label use. Expectations are not actual values with a statistical distribution, which complicate the use of standard sensitivity analyses and scenario analyses are more appropriate for expectations. Expectations are based on the expected use of the new drug by the medical community based on its clinical profile and drug price.
The Discounted Cash Flow method can be used to validate the price of the new drug from a narrow investor’s perspective, which does not include all other monetary and non-monetary values for society (patients, physicians, payers, providers and employers) (Figure 2). The substitution effect of a new medicine may lead to substantial cost savings in other budgets e.g. reduction of hospitalization costs due to higher efficacy or reduction of treatment costs for adverse events resulting from a better safety profile.
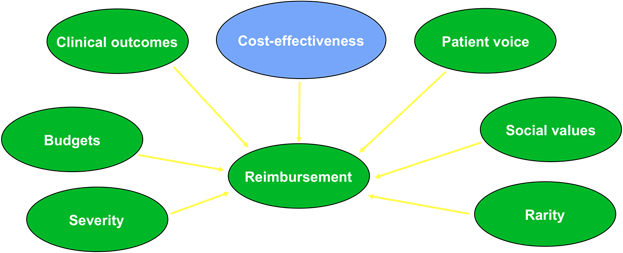
Figure 2:Value of innovation includes more than cost-effectiveness
The substitution effect and the gain in QALYs of a new medicine are not included the Discounted Cash Flow method. However investors have multiple functions since they are not only professional investors, but also insured citizens. Therefore the decision making process does not only include economic attributes but also other values, e.g. social values. Therefore, this substitution effect and the gain in QALYs may already partially be included in the current financial valuation from an investor’s perspective.